Crude Oil Prices Unable to Capitalize on Supportive Inventory Data
struggle even as EIA reports surprise inventory drop set fresh monthly lows as Fed rate hike speculation swells Retail traders see gold rising. what this hints about the trend Crude oil prices continue to struggle for a lasting directional lead, with the WTI benchmark oscillating in a narrow range having touched a five-month high earlier in the week. Even an EIA report showing inventories shed 1.85 million barrels last week a rosy outcome even compared with , to say nothing of consensus bets on a 2.5 million barrel build failed to rekindle upward momentum.
A lull in top-tier news flow might make it all the more difficult to find direction in the near term. Still, it ought to be kept in mind that the absence of a clear focal point capturing the markets' undivided attention makes for a headline-sensitive environment prone to knee-jerk volatility. That means traders may pounce on something relatively benign, like a vague comment floating the possibility of extending OPEC-led output cuts.Gold prices are facing heavy selling pressure as mounting Fed rate hike speculation translates into parallel gains for Treasury bond yields and the . That understandably undermined support for non-interest-bearing and anti-fiat assets epitomized by the yellow metal. A revised set of second-quarter US GDP figures is now in focus, but .
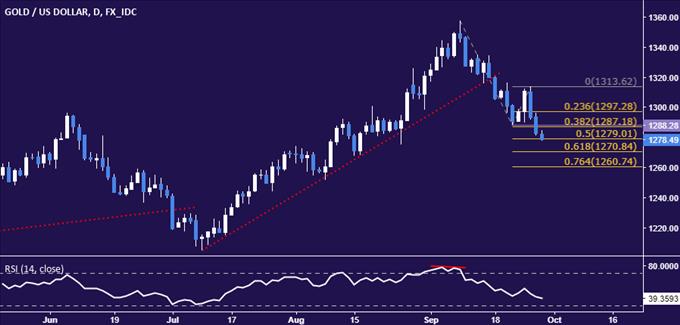
What are the fundamentals driving long-term crude oil price trends? !GOLD TECHNICAL ANALYSIS Gold prices are setting fresh monthly lows after an aborted attempt at a recovery. From here, a daily close below the 50% Fibonacci expansion at 1279.01 exposes the 61.8% level at 1270.84. Alternatively, a move back above the September 21 bottom at 1288.28 targets the 23.6% Fib at 1297.28.
Chart created using TradingView
CRUDE OIL TECHNICAL ANALYSIS Crude oil prices continue to mark time, digesting gains after breaking above the May 25 highat 51.97. The next significant level of resistance lines up in the 53.74-54.48 area. Alternatively, a move back below 51.97 now acting as support opens the door for a retest of the August 1 high at 50.40.
Chart created using TradingView
--- Written by Ilya Spivak, Currency Strategist for DailyFX.comTo receive Ilya's analysis directly via email, please
Contact and follow Ilya on Twitter:
provides forex news and technical analysis on the trends that influence the global currency markets.

Legal Disclaimer:
MENAFN provides the
information “as is” without warranty of any kind. We do not accept
any responsibility or liability for the accuracy, content, images,
videos, licenses, completeness, legality, or reliability of the information
contained in this article. If you have any complaints or copyright
issues related to this article, kindly contact the provider above.


Comments
No comment