DXY Drops on Trump Threat, Crude Oil Price Rises On US Stock Decline
Dollar defensiveness resumes on data weakness ahead of Jackson Hole Crude Oil price rises on eight straight draw of US stockpiles British Pound set for lowest close against the since 2009 bets on a rebound jump per IGCS, favoring further downside The US Dollar Index (DXY) dipped again on Wednesday thanks, in part, on renewed fear of internal political risk and weak data. The two themes have consistently plagued the over 2017 and remains a reason why traders consistently discount the probability of a Fed rate hike in the coming meetings. The December meeting is expected to pass without a Fed hike, and the market is close to pricing out a hike in the March 21, 2018, meeting when the Fed may have a new chairperson.
The other two currencies that took many trader's attention today was the British Pound and the New Zealand Dollar. The Pound ended the day at the lowest close vs. the Euro since 2009 after a report came out showing business feel less confident about the UK economy amid Brexit concerns and recent reports of the UK Government backing away from a hard stance of Brexit negotiations have failed to lead to traders bidding the currency.
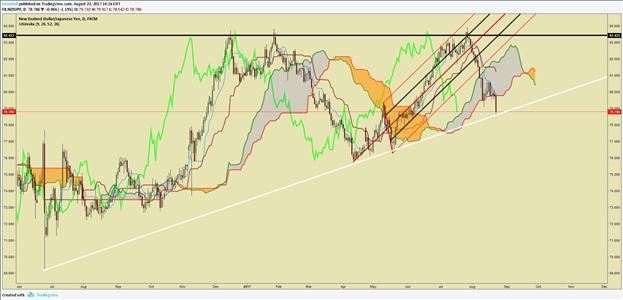
Down under, about future growth had a particularly negative effect on (chart below), which is testing a Trendline drawn up from the Brexit low in June.Lastly, the envy in global markets remains commodities. On Wednesday, WTI Crude Oil rose for the second day on the eighth straight decline in US stockpiles, which took the over stockpiles in the US to the lowest levels since January 2017. The downside in the report is that US production remains on the rise, and if the seasonal effects of summer demand wane or hurricanes reduce demand from refiners, a supply glut could resume.
For technical guidance on Crude Oil,Are you looking for trading ideas? Our Q3 forecasts are fresh and ready to light your path.
JoinTylerin histo discusstradeable market developments.FX Closing Bell Top Chart: NZD/JPY testing Trendline support from the Brexit low
Chart Created by Tyler Yell, CMTGBP Gross Domestic Product (YoY) (2Q P)
NZD bets on a rebound jump per IGCS, favoring further downsideThe sentiment highlight section is designed to help you see , and how client positioning can lead to trade ideas. If you have any questions on this indicator, you are welcome to reach out to the author of this article with questions at .
NZDUSD: Retail trader data shows 44.0% of traders are net-long with the ratio of traders short to long at 1.27 to 1. In fact, traders have remained net-short since May 24 when traded near 0.68301; price has moved 5.8% higher since then. The number of traders net-long is 19.6% higher than yesterday and 41.7% higher from last week, while the number of traders net-short is 4.4% lower than yesterday and 13.2% lower from last week.We typically take a contrarian view to crowd sentiment, and the fact traders are net-short suggests NZDUSD prices may continue to rise. Yet traders are less net-short than yesterday and compared with last week. Recent changes in sentiment warn that the current NZDUSD price trend may soon reverse lower despite the fact traders remain net-short. (emphasis added).
---Written by Tyler Yell, CMT, Currency Analyst & Trading Instructor for DailyFX.com
To receive Tyler's analysis directly via email, pleaseContact and discuss markets with Tyler on Twitter: @ForexYell

Legal Disclaimer:
MENAFN provides the
information “as is” without warranty of any kind. We do not accept
any responsibility or liability for the accuracy, content, images,
videos, licenses, completeness, legality, or reliability of the information
contained in this article. If you have any complaints or copyright
issues related to this article, kindly contact the provider above.


Comments
No comment