Technique developed in Kenya offers a refined way to map tree cover
'Land use and cover change' are terms used by scientists changes to the earth's surface. This can be due to natural causes or because of the way in which land is put to use by people. Land use refers to what's being done on it, for example mechanised farming, while land cover refers to what is physically on the land, for example what crops are being grown.
What's important about the new approach is that the maps consist of an array of both physical and human geographic data to explain changes. It can also be used in combination with large-scale climate models, for example to understand how changes in vegetation in East Africa might be affecting climate in other regions of Africa.
In Kenya's case, the system mapped changes in agriculture and natural vegetation with information from over a 30-year period. Using a series of aerial photographic surveys – which could be used to distinguish specific crops or natural vegetation – and freely-available spatial data such as rainfall, and population density, interpreters were able to classify Kenya's land use and cover change. They were then able to construct maps of this change on a yearly basis without extensive and costly field visits typically used when mapping change.
Understanding land use and cover change is important because they both affect how land responds to the environment. Many of the changes are human-induced – for example the way that people use the land can lead to habitat loss, increase the stress of life that the land supports, affect greenhouse gas emissions and storage, modify runoff and ground water storage, or the climate.
Deforestation, perhaps the most type of land use and cover change, comes about primarily from agriculture and logging. It has an impact on the world's climate because trees store huge amounts of carbon that would otherwise be in the air trapping heat. The absence of trees therefore contributes to global .
Deforestation also affects people locally, in the global south. Forests help regulate rainfall and water storage, and the help maintain a high level of biodiversity.
Much of the global north has seen an increase in tree cover in recent years. But much of the global south continues to due to population growth, weak institutions and other social and ecological factors.
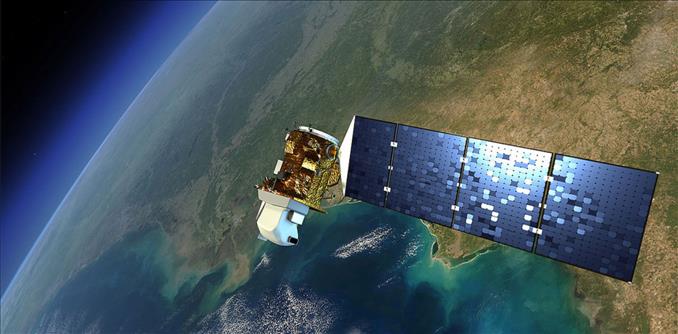
Mapping deforestationTo understand the drivers as well as the effects of deforestation, geographers use various tools that map the extent and density of tree cover. These include aerial photos, satellite images and other spatial data through time.
The World Agroforestry Centre's approach takes this a number of steps further. It also uses demographic data, such as population density, which is often bypassed by scientists when mapping change.
The new approach suggests that physical drivers, like rainfall, may not be as important as previously thought.
Finally, the new technique provides a way forward for scientists interested in understanding what drives land use and cover change. It allows them to look at how this process interacts with processes like climate change over large areas and long periods of time.
From a scientific perspective, this helps us better to understand the environment and how humans may be modifying it. This in turn will help those designing land management strategies.
Kenyan caseOur research in Kenya shows that the most important predictor of land use and cover change was population density. Kenya is part of the East African Horn region. Like many other countries in Africa, its population is and is largely devoted to rain-fed subsistence and .
Population growth occurred more rapidly in fertile areas, so the conversion of natural vegetation to agriculture was much higher. In less fertile areas, population growth was much slower, so the conversion was less.
Kenyan farmers and pastoralists are largely unable to acquire new land and are instead forced to intensify their practices on .
We were able to detect that as the number of people per square kilometre increased, the amount of natural vegetation declined, because it was being replaced by farm or grazing land.
Climate predictors, such as rainfall and air temperature, were also correlated with the conversion of natural vegetation to agriculture, but less so compared to population density.
As seen in the Kenya case, the growing demand for food in Africa must be met with effective land tenure reform. By mapping changes in our environment continuously over long time periods, farmers and policymakers can understand underlying mechanisms and explore opportunities for reform.

Legal Disclaimer:
MENAFN provides the
information “as is” without warranty of any kind. We do not accept
any responsibility or liability for the accuracy, content, images,
videos, licenses, completeness, legality, or reliability of the information
contained in this article. If you have any complaints or copyright
issues related to this article, kindly contact the provider above.


Comments
No comment