(MENAFN- ProactiveInvestors) Where is all the oil coming from
Oil inventories continue to surge but U.S. production has flatlined for weeks—even months.
I mean really—look at these simple facts that have been staring the Market in the face for months:
- Year-to-date (YTD) production in 2015 in the U.S. is only 160000 bopd (barrels of oil per day) above December levels—multiply that by 7 days a week to get 1.12 million barrels a week.
- Demand in the U.S. is up by A LOT more—depending on which analysts/firm you want to believe—jU.S.t under 800000 bopd. Refineries are running at record high throughputs jU.S.t to keep up (92.3% now vs. 5-yr average of 87.8%)!
Yet U.S. oil inventories continue to climb—by a stunning 6.54 million barrels a week so far this year—almost 300% over the typical December-May 1.71 million barrels per week. So U.S. production YTD only accounts for 17% of this. What gives
This huge growth in inventories has caused some high profile analysts to call for $20 oil. The idea of oil storage becoming full in the U.S. caused a second big downleg in March in WTI prices—set in Cushing OK—to a low of $42/barrel.
The reason behind this seeming paradox When you look at the data the creators of South got it right – we should really ‘Blame Canada!’
Two new pipelines recently debottleneck crude flows from Canada to the Gulf of Mexico resulting in a 13.99% increase (408000 bopd) in U.S. crude oil imports from Canada in December (2.86 million additional barrels per week) that has largely been maintained. When you contrast that fact to the US oil inventory build in the first chart below—well that’s almost all you need to know.
The vast majority of Canadian oil exports is heavy oil from the oilsands. While shale production—light oil—begins to stall and fade oilsands production will increase every year for at least the next five years. Growing production and heavy discounts (pun intended) will keep U.S. refiners processing all the Canadian heavy oil—called Western Canada Select or WCS—they can.
Even worse crude oil imports are increasing as East and West coast refiners increase utilization requiring them to consume additional seaborne crude (from Saudi Arabia and other places) in order to maintain their crude input blend slate: As U.S. refinery utilization increased from 89% to 92% over the past four weeks total U.S. crude oil imports have averaged 7.56 million bopd well above the YTD average of 7.26 million bopd and the March average of 7.25 million bopd.
Unless U.S. shale production falls dramatically (and soon) the U.S. crude inventory situation could get very ugly this summer as 1-3 million weekly builds continue - just as investors have written off full inventories as a risk factor!
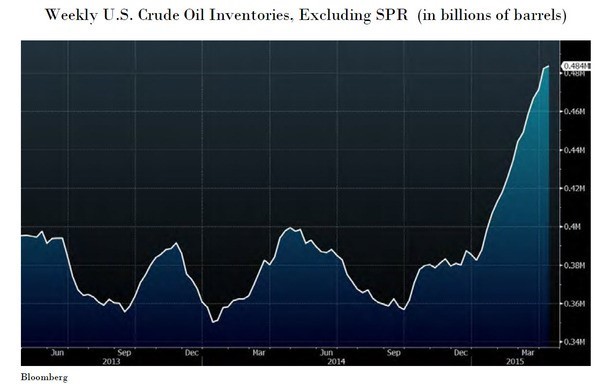
The Development of U.S. Crude Oil Inventories
Analysts generally blame a surge in domestic crude oil production or reduced crude oil refinery utilization for the sharp growth in U.S. inventories over the past three months. Others hold onto various conspiracy theories including the belief Saudi Arabia is intentionally stuffing crude oil (from various countries) into Gulf Coast storage facilities in order to drive down WTI crude prices and spare Brent pricing.
Before we truly "Blame Canada!" let’s put those theories to bed first: See this chart of U.S. crude oil inventories (DOESCRUD <Index> on Bloomberg) which clearly shows the surge began in early January:
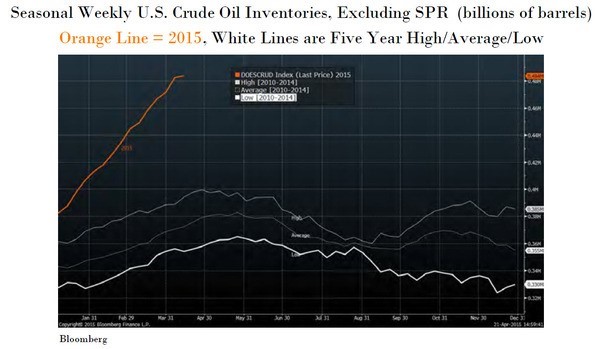
Rebasing the above chart to show the seasonality of inventories over the past five years (see below) shows that on average U.S. crude oil inventories grow by a total of 36 million barrels (1.71 million barrels per week) from the end of December through the end of May.
So far in 2015 inventories have increased by a stunning 98.23 million barrels (6.54 million barrels per week) and unless U.S. shale production falls off a cliff in the next 3-5 weeks are on track to grow by a further 20+ million barrels by the end of May!
Is Surging U.S. Production to Blame
The previous crude oil inventory charts show something clearly changed at the beginning of the year. While many blame surging U.S. crude oil production the official EIA monthly data shows production increased from 9.11 million bopd in November to 9.32 million bopd in December before declining to 9.19 million bopd in January.
The EIA’s Weekly Petroleum Status Reports estimate U.S. crude oil production increased from 9.06 million bopd in November to 9.13 million bopd in December 9.19 million bopd in January 9.28 million bopd in February and 9.39 million bopd in March – as the following chart from Bloomberg shows (DOETCRUD <Index>):
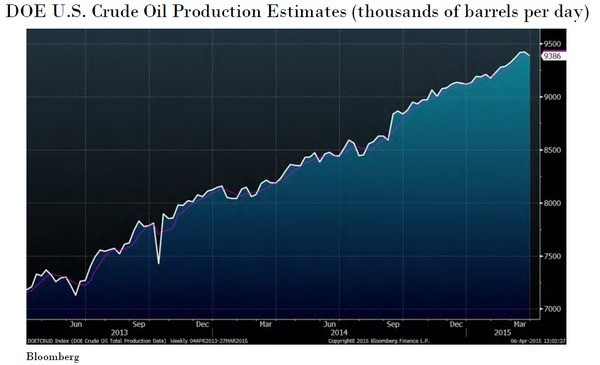
The continued growth in U.S. crude oil production isn’t surprising given the lag between drilling activity and first production. The DOE weekly crude oil production data shows production has increased 0.26 million bopd since December.
More importantly year-to-date production has only averaged 0.16 million bopd above December levels - an increase of just 1.12 million barrels per week. This says two things: First the average increase in U.S. crude oil production year-to-date accounts for only 17% of the 6.54 million barrel per week average increase in inventories.
Second-unless U.S. light oil production growth falls dramatically-and soon-weekly inventory builds should be increasing.
Refinery Utilization is Seasonally High
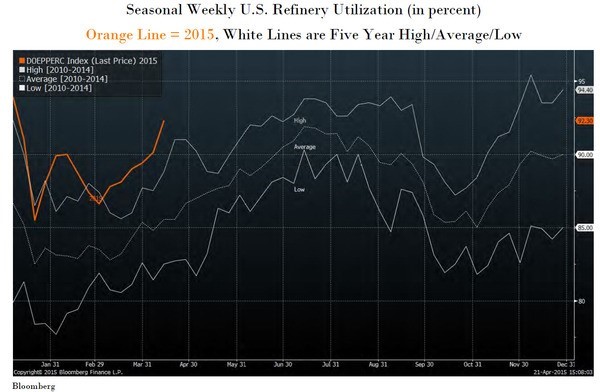
Low crude oil refinery utilization is another commonly-cited reason for rising crude inventories but in reality refinery utilization (DOEPPERC <Index> on Bloomberg) sits at 92.3% compared to an average of 90.2% for all of 2014and an average of just 87.8% over the past five years.
If we look at the seasonality of refinery utilization we find the current utilization rate is a stunning 6.8% above the five year average of 85.3% for this week in April. Despite what is reported in the media since November U.S. crude oil refineries have regularly been running at the highest utilization rates in more than five years as the following chart shows:
If refinery runs revert to the mean it would mean a big jump in inventories. All this means analysts are now potentially under-estimating the risk U.S. crude inventories will continue to grow through the summer.
Look at the calculations: U.S. crude oil refining capacity as reported by the DOE is 17.89 million bopd. The current refinery utilization rate of 92.3% equates to 16.51 million bopd of total throughput. If refinery utilization increases to 94% this summer roughly 1.0% above peak summer utilization rates of the past five years total refinery throughput will increase by 0.30 million bopd (to 16.81 million bopd).
Even with the resulting increase in crude oil demand (+2.13 million barrels per week) U.S. light oil production would have to collapse or else crude oil inventories could continue to increase one to three million barrels per week during the peak refining season!
This is exactly what happened in December when U.S. refinery utilization rocketed to almost all-time highs (an unbelievable 94.2% for the month of December—traditionally the LOWEST time of year) as refiners took advantage of newly increased flow of cheap Canadian crude and built refined product inventories.
U.S. Crude Oil Imports from Canada (finally-BLAME CANADA!)
As mentioned in the intro-two new pipelines recently debottleneck crude flows to the Gulf of Mexico from Canada: 's 600000 bopd Illinois-to-Oklahoma Flanagan South pipeline and ' 450000 bopd Oklahoma-to-Texas Seaway Twin.
While the Texas Seaway Twin pipeline was technically operational in October the December start-up of the Flanagan South pipeline was necessary to feed it Canadian crude. Together these two new pipelines led to a 13.99% increase (408000 bopd) in U.S. crude oil imports from Canada (DOCRCANA <Index>) in December (2.86 million additional barrels per week) as the following chart shows:
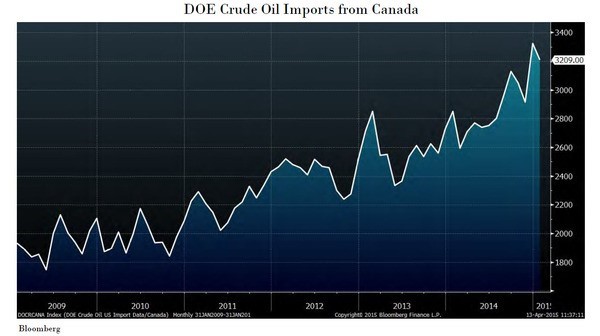
A 2.86 million barrel per week increase in crude oil imports from Canada accounts for 44.7% of the 6.54 million barrel per week growth in U.S. crude oil inventories so far this year. This is by far the largest single factor driving the sharp increase in inventories yet it is rarely reported as the cause by the media or analysts.
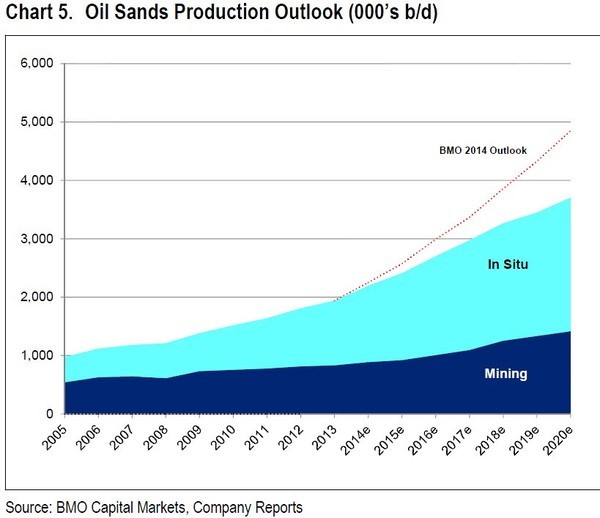
The Outlook for Canadian Crude Oil Production
With WTI crude priced at $55.00 per barrel and Canadian heavy crude (WCS) priced $12.00 per barrel below WTI it is easy to see why Gulf Coast refiners welcome all the Canadian heavy crude they can process - but how will Canadian crude oil producers respond to the current price environment
Most of Canada’s production is heavy oil from the oilsands in Alberta. BMO Nesbitt Burns Canada’s 2nd largest retail brokerage firm says that despite a sharp drop in spending they expect oil sands production to grow roughly 10% in 2015 to 2.4 million bopd as several new start-ups come on line.
And with break-even costs of $25/barrel for in-situ producers that growth is not threatened.
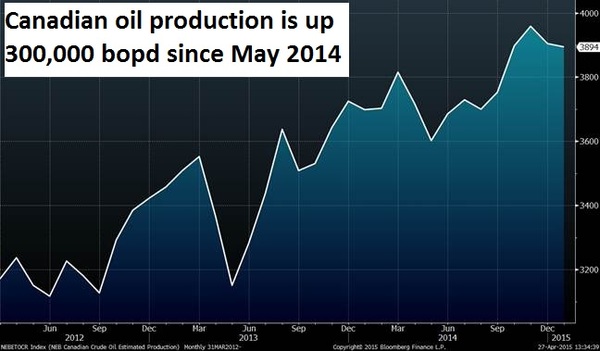
Canada’s National Energy Board (NEB) is calling for Canadian crude oil production to increase from 3.76 million bopd in 2014 (3.91 million bopd in December) to 3.89 million bopd in 2015 while OPEC is expecting Canadian production to increase by only 20000 bopd in 2015.
First Energy suggests that overall Canadian oil production will continue to rise even with a decline in light oil production:
A wide array of Canadian production forecasts from Wall Street analysts effectively predict production will be flat. This is what overall Canadian oil production looks like in the last three years:
Conclusions
Oil prices have rallied the past few weeks as investors believe (for various reasons) the worst of the U.S. inventory builds are behind U.S. That’s true but it’s still unclear how much U.S. crude oil production will decline or that refiners will be able to consume all of the crude available this summer.
But Canada's oil supply continues to increase and more of it is finding a way into the U.S. As a result U.S. crude oil inventory builds could continue through the peak summer refining season - possibly at a rate of 1-3 million barrels per week.
This negative surprise could lead to another leg down in crude prices (particularly WTI) as investors (eventually) realize just how oversupplied the North American market is.
Even worse crude oil imports are increasing as East and West coast refiners increase utilization requiring them to consume additional seaborne crude in order to maintain their crude input blend slate: As U.S. refinery utilization increased from 89% to 92% over the past four weeks total U.S. crude oil imports (DOEICESP <Index> on Bloomberg) have averaged 7.56 million bopd well above the YTD average of 7.26 million bopd and the March average of 7.25 million bopd.
The U.S. crude inventory situation could get very ugly this Summer - just as investors have written off full inventories as a risk factor!
And you can Blame Canada!
(South’s (very) off-colour sketch by the same name can be found here-http://bit.ly/BlameCanada1)
EDITORS NOTE: If this scenario plays out this summer refinery stocks will benefit the most. They are very profitable right now. Click HERE to understand the profit potential for my two favourite refinery stocks.
-Keith
Legal Disclaimer:
MENAFN provides the information “as is” without warranty of any kind. We do not accept any responsibility or liability for the accuracy, content, images, videos, licenses, completeness, legality, or reliability of the information contained in this article. If you have any complaints or copyright issues related to this article, kindly contact the provider above.